


COVID-19 Tracker application using Tkinter | Python
As we know, the world is suffering from coronavirus COVID-19 pandemic, it's not just a pandemic it is a global health crisis. So we all need to be updated about the total number of confirmed cases, how many confirmed cases have been recovered, the number of active cases, and the number of deaths due to Coronavirus. We can get the updates through news channels and websites. Some of the countries are using mobile apps for getting updates too. All these are possible due to information technology.
Python provides the “COVID” library to get information about COVID cases all over the world and country-wise as well. So we will use python libraries to get information about the global spread of coronavirus and country-wise as well.
Through this article, we will discuss how we can create COVID-19 tracker Application GUI using Tkinter python and to encoding the "COVID" related information into visual objects to get the visualized updates in graphical format.
Here, we are creating GUI and after entering the correct details of the country, we can easily get the information plotted on the bar graph, we can enter any number of the country names as much we want but it must be separated either by white spaces or commas but not both. If we type incorrect country name or if not follow the separator rules between the names then we will get an exception on the GUI as "Enter the correct details please." so that all about the interface.
For the development of this interface, we need to import some of the libraries, the list of libraries that we will use are listed below.
- COVID library: forgetting the COVID-19 data of each country.
- Matplotlib library: for visualizing the CoVid-19 data.
- Tkinter library: for creating GUI.
1.COVID library: Python provides “COVID” library which tells us all the
COVID related information globally and country-wise as well. So using this library we will get the information about a number of confirmed cases, active cases, recovered cases, and the number of deaths.
The syntax for installation:
pip install covidThe syntax for importing:
from covid import Covid2.Matplotlib library: It is used for visualization in python. It makes things easier and more possible. It provides a way to create and quality plot static, interactive, and animated visualization with few lines of code.
The syntax for installation:
pip install matplotlibThe syntax for importing:
from matplotlib import pyplot as plt(here we will use plot as it is a collection of styles in python to create a plotting area in the figure, plot some lines in the plotting area and helps to decorate the plot with labels, etc.)
3.Tkinter Library: This is one of the commonly used libraries to create
Graphical user interface applications in Python. For more details, I would suggest reading my previous articles, in those articles you will get to know more about Tkinter, Tkinter widgets, methods and attributes that can be used to create a beautiful GUI application.
The syntax for installation:
pip install tkinterThe syntax for importing:
from tkinter import *(to import all the files of Tkinter library )
Now let's discuss the code that I have used for developing the COVID-19 Tracker application.
CODE:
Explanation of each line of code is commented on. So please read the comments before using the code for better understanding.
# importing all tkinter files
from tkinter import *
# create instance of tkinter
root = Tk()
# setting geometry of tkinter window
root.geometry("450x450")
# setting title of tkinter window
root.title("CORONAVIRUS (COVID-19) UPDATE")
# defining the function to fetch the data from covid library and to show it.
def covid_data():
# importing matplotlib which will be used to show data graphically
from matplotlib import pyplot as plt
# to scale the data we are importing patches
import matplotlib.patches as mpatches
# importing covid library
from covid import Covid
# initializing covid library
covid = Covid()
# this declares empty lists to store different data sets
cases = []
confirmed = []
active = []
deaths = []
recovered = []
# using Exception Handling to handle the exceptions.
try:
# updating root(tkinter window)
root.update()
# getting countries names entered by the user using get() method.
countries = data.get()
# removing white spaces from the start and end of the string
country_names = countries.strip()
# replacing white spaces with commas inside the string
country_names = country_names.replace(" ", ",")
# splitting the string to store names of countries
# as a list
country_names = country_names.split(",")
# for loop to get all countries data
for x in country_names:
# appending countries data one-by-one in cases list
# here, the data will be stored as a dictionary
# for one country i.e. for each country
# there will be one dictionary in the list
# which will contain the whole information
# of that country
cases.append(covid.get_status_by_country_name(x))
# updating the root
root.update()
# for loop to get one country data stored as dict in list cases
for y in cases:
# storing every Country's confirmed cases in the confirmed list
confirmed.append(y["confirmed"])
# storing every Country's active cases in the active list
active.append(y["active"])
# storing every Country's deaths cases in the deaths list
deaths.append(y["deaths"])
# storing every Country's recovered cases in the recovered list
recovered.append(y["recovered"])
# marking the color information on scaleusing patches
confirmed_patch = mpatches.Patch(color='blue', label='Confirmed')
recovered_patch = mpatches.Patch(color='green', label='Recovered')
active_patch = mpatches.Patch(color='red', label='Active')
deaths_patch = mpatches.Patch(color='black', label='Deaths')
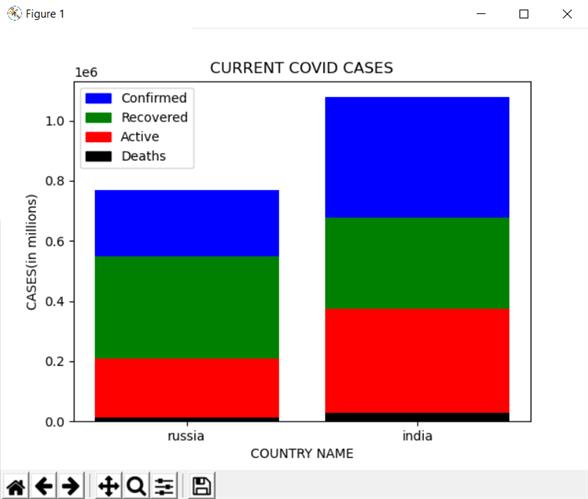
# plotting the scale on graph using legend()
plt.legend(handles=[confirmed_patch, recovered_patch, active_patch, deaths_patch])
# showing the data using graphs
for x in range(len(country_names)):
plt.bar(country_names[x], confirmed[x], color='blue')
if recovered[x] > active[x]:
plt.bar(country_names[x], recovered[x], color='green')
plt.bar(country_names[x], active[x], color='red')
else:
plt.bar(country_names[x], active[x], color='red')
plt.bar(country_names[x], recovered[x], color='green')
plt.bar(country_names[x], deaths[x], color='black')
# setting the title of the graph
plt.title('CURRENT COVID CASES')
# giving label to x direction of graph
plt.xlabel('COUNTRY NAME')
# giving label to y direction of graph
plt.ylabel('CASES(in millions)')
# showing the full graph
plt.show()
except Exception as e:
# the user must enter the correct details during entering the country names
# otherwise, they will enter into this section
# so ask them to diffrentiate the names using comma or space but not both.
data.set("Enter the correct details please:")
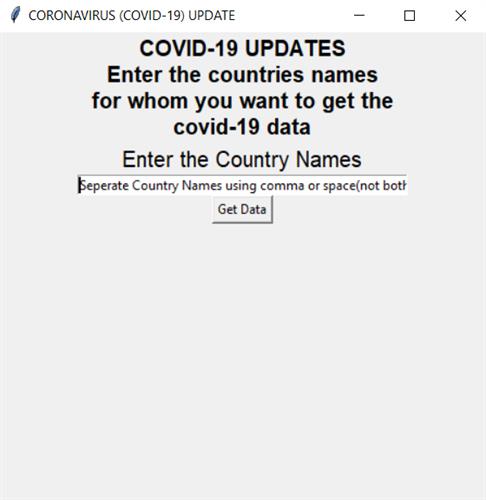
Label(root, text="COVID-19 UPDATES\nEnter the countries names\nfor whom you want to get the\ncovid-19 data", font="LUCIDA 15 bold").pack()
Label(root, text="Enter the Country Names", font="bold").pack()
data = StringVar() #creating instance of StringVar()
#setting the text that will be displayed by default on GUI application.
data.set("Seperate Country Names using comma or space(not both)")
#Entry widget is used to accepts the string text from the user.
entry = Entry(root, textvariable=data, width=50).pack()
#here Button widget is used to create a button that will call the function "covid_data"
#created above when any on-CLICK event will occur.
Button(root, text="Get Data", command=covid_data).pack()
#this helps to run the mainloop
root.mainloop()
OUTPUT:
GUI Application:
Entering the country name:
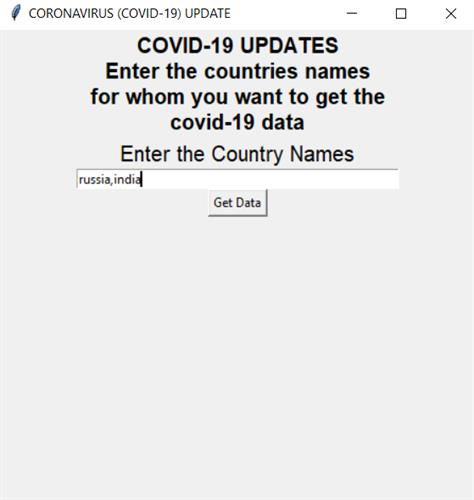
Figure:
In upcoming articles, we will learn more about python. Hope you like this article, if any query regarding python
Then please feel free to comment and keep sharing with your friends.
Till now, Stay home, stay safe, and keep on learning.😊😊😊