


Deep Dive Into PowerBi | What is the Power BI?
This is the first article of the Power BI series. In this article, we will discuss PowerBi and why we used PowerBi for business intelligence and we also discussed the feature of PowerBi
let's start
What is the Power BI?
Power Bi is a business intelligence tool from Microsoft, it is packed with the powerful features to enhance the development experience. According to my experience of The Power Bi, that is the best data visualization tool available in the market. It provides the capability of data warehouse such as data discovery, Data Visualization, Dashboard preparation that is very helpful to decision making. PowerBi is also embedded on the Azure cloud platform.
History of PowerBi
Power Bi was firstly named as Project Crescent and it was designed by Ron George in 2010. Project Crescent was publicly available in July 2011 but later on project crescent renamed as PowerBi. The first version of PowerBi was Microsoft Excel-based add-ins after a year Microsoft adds some more features and capabilities into Power Bi and released with office 360
Features of Power Bi
Microsoft tagline for power Bi - Any data, anywhere, any time
Power Bi provides the many features to analyze the data that helps in higher management decision making if we can understand the tagline it means it is platform-independent, I listed the feature of Power Bi below.
- Platform Independent
- Also, a cloud-based
- Easy to used
- Support of powerful programming languages like Python and R script
- Interactive
Power Bi is most used for Dashboard Designing for small to large organizations, when I discuss with developers they asked one common question in how many days we get expertise in Power Bi. I always reply it depends on three major factor
- understanding the problem -(first step)
- Understanding of data (cleaning of data) -(second step)
- understand of layout and color combinations --(third step)
I show you guys my dashboard that really helped to understand what I am saying.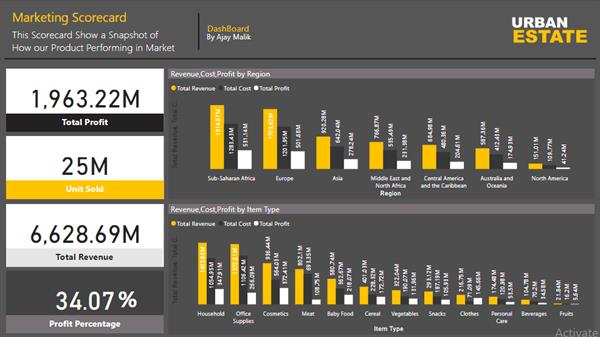
Dashboard I showed you guys, is about sales in different regions, profit, and revenue of company.
In the coming articles, we will discuss and learn a to z of PowerBi.