


All About PowerBI Vs Tableau | Deep Dive Into PowerBI
The previous article of this series was about Steps to Creating Static Table in PowerBI. If you want to read the previous article click on the Link
In this article, we will talk about the comparison between PowerBI and tableau because everyone wants to know what is best in the market, which one we use for business intelligence.
Personally, it is very difficult to say which one is best in the market, they both have many great features. We do search for business intelligence tools on the internet there are so many options are available but Power BI and tableau are always on top.
What are the criteria for choosing a business intelligence solution?
In the Development of Business intelligence, every developer and client wants to develop the best solution for their need. Now we can talk actual requirements for the selection of tool, BI solutions for an enterprise is depending on the nature of business, business niche, size of the business, type of business, workforce necessities and customer requirements. Sometimes we go with a cost-effective tool
According to some sources tableau having the highest number of users, it might be due to cost and requirement for developer or client. But nowadays Microsoft started capturing market with advanced features.
PowerBI vs Tableau

Comparison On capability
|
|
PowerBI |
Tableau |
|
Data Visualization |
Having decent visuals. |
Having More visuals then PowerBI. |
|
Analytics |
Both Capable to do Analytics. |
Both Capable to do Analytics. |
|
Online Analytical Processing |
Both support OLAP. |
Both support OLAP. |
|
Document Management |
Both Capable to do. |
Both Capable to do. |
|
Decision Services |
Microsoft having very rich Decision Services. |
Tableau also has Decision Services. |
|
Integrations |
Microsoft PowerBI is more capable to connect with multiple sources. |
Tableau also has different Data Source |
|
Big Data Integration |
PowerBI is Highly capable to do. |
Tableau can do this but as compared to PowerBI, Tableau has not more effective |
Dashboard Comparison
First, we look at the dashboard then we will discuss it.
Tableau Dashboard: source- link
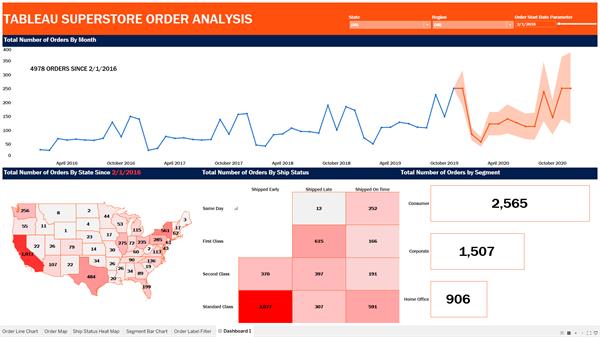
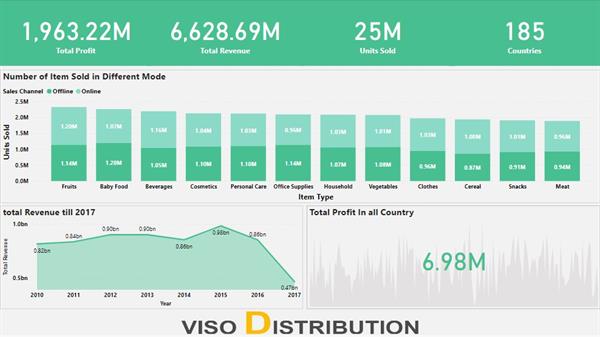
Both the dashboards are very close identical but the main difference is visual that we used is both dashboards, working, and capabilities of visuals are different. Both Dashboard having filters, graphs, maps, etc. The look of all dashboards are slightly different. After you can see the dashboard guys you understand what is the main difference.
Some major differences between Tableau vs. Power BI
|
Tableau |
Power BI |
|
Tableau BI can handle a huge amount of data with High performance. |
Power BI can handle a limited amount of data. |
|
Tableau is known for its data visualization functionality. Tableau having 24 different types of visualizations. |
PowerBI provides numerous data points to offer data visualization. PowerBI is offering more than 3500 data points for drilling down the dataset on the dashboard. |
|
Tableau has rich customer support. It has a large community. |
PowerBI provides limited customer support for a free PowerBl account. But, the paid version users will get high support form Microsoft. |
|
Tableau works best when there is a large amount of data in the cloud or other sources. |
PowerBl doesn't work better with a large amount of data |
|
Analysts and experienced- users mostly use tableau for analysis. |
It is used by both Fresher and experienced users because of its user-friendly developing Environment. |
|
Tableau is a little difficult to use and complicated. |
Power BI Interface is very easy to learn and a very attractive Developing Environment. |
|
The information can be stored in the Tableau server. |
Power BI more focused on reporting and analytical modeling, not for storing the data into the server. |
|
Suitable for medium & Large type of Organization for Data Visualization. |
Suitable for Small, medium & large type of organization for data visualization. |
|
Tableau uses MDX for measures and dimensions to meet user requirements. |
Power BI use DAX for calculating and measuring columns for data transformation. |
|
Tableau can connect to limited data sources. |
Power BI having a large number of data sources. |
|
In Tableau Embedding, reports are a real-time challenge |
Embedding our reports is easy in PowerBI. |