

Monitoring Azure VM -Windows services with Log Analytics
Monitoring Azure VM -Windows services with Log Analytics
One of the frequently asked questions how do we monitor the state of any Windows Services which are running inside an Azure VM’s.
One of the best options for monitoring of services across Windows and Linux leverages using Azure Log Analytics.
In this approach, we will be looking step by step approach to get any Windows Service state.
- This can be achieved with monitoring processes by using performance counters.
- Right now Windows services events information will be collected every 5secs, If there is no change, then there is no data sent to Log Analytics.
- You do not have to add a performance counter for each process, you just need to add only one event log to monitor all services. (Until an unless you want explicitly).
- The services are shown with their actual name that is used in services.msc or Get-Service cmdlet.
- We have the actual state of the service when it happened.
Step by Step Process to achieve this.
As a part of the pre-requisite we will create (new) below services in advance:
- Azure VM
- Azure Log Analytics workspace
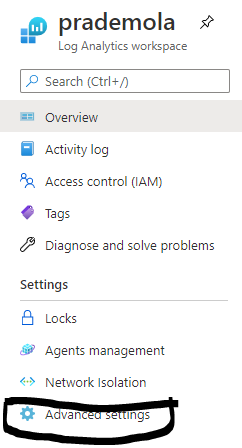
- Go to Log Analytics Workspace →go to Settings → Click on Advanced Settings →
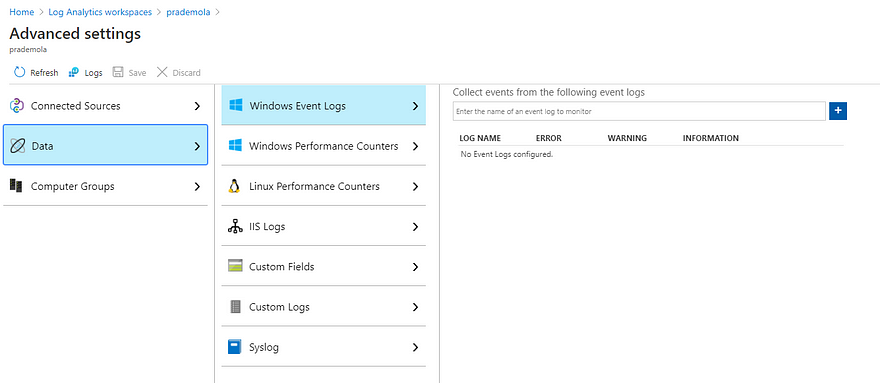
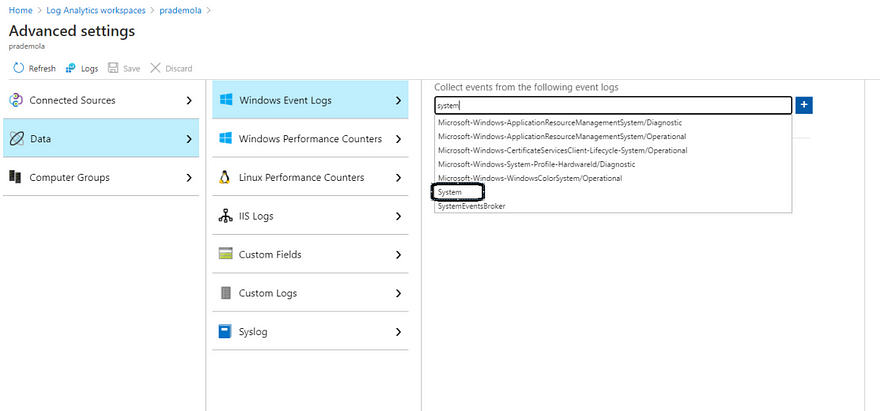
→ Click on Data → Select “Windows Event Logs” → Under Collect events from the following → Type “System” → click on + sign
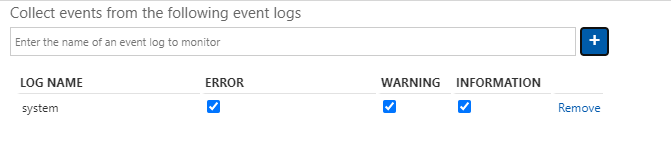
If you want to capture Application-Specific Logs → then type “Application” → click on + to add and then Save. So along with the system, you should see a new entry for “application”.
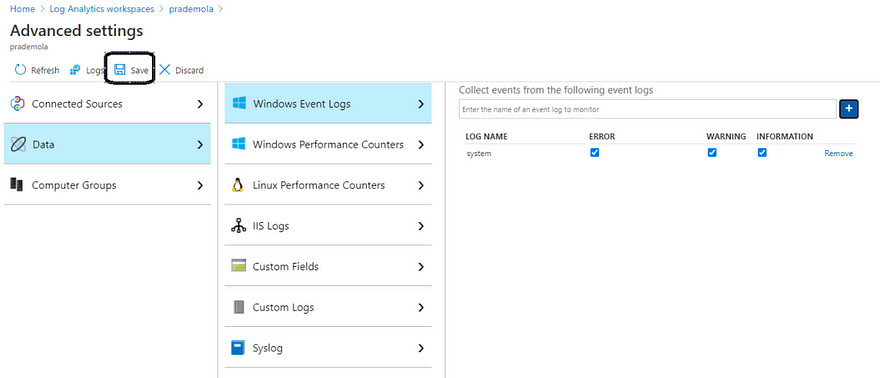
Save.
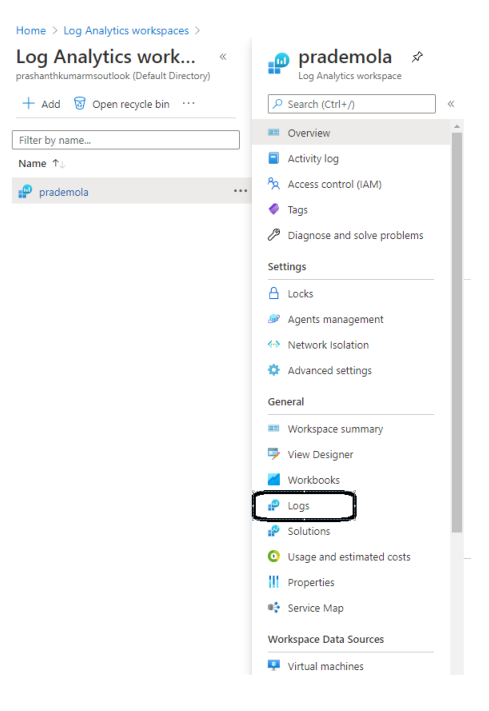
2. As a quick check Open Log Analytics workspace → Go under General → click on Logs
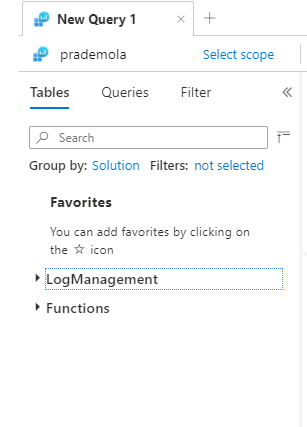
3. For the first time you can see only 2 tables by default
- log management
- Functions
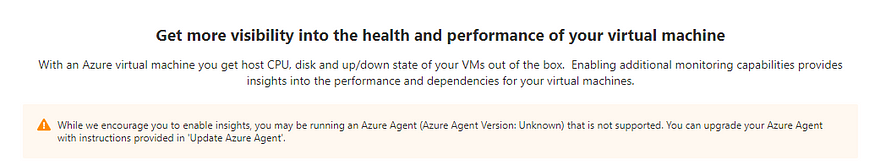
4. Now let's configure the same on Azure VM, Once the virtual machine is ready then go to the Monitoring section → Check for Logs → you have an option of Enable.
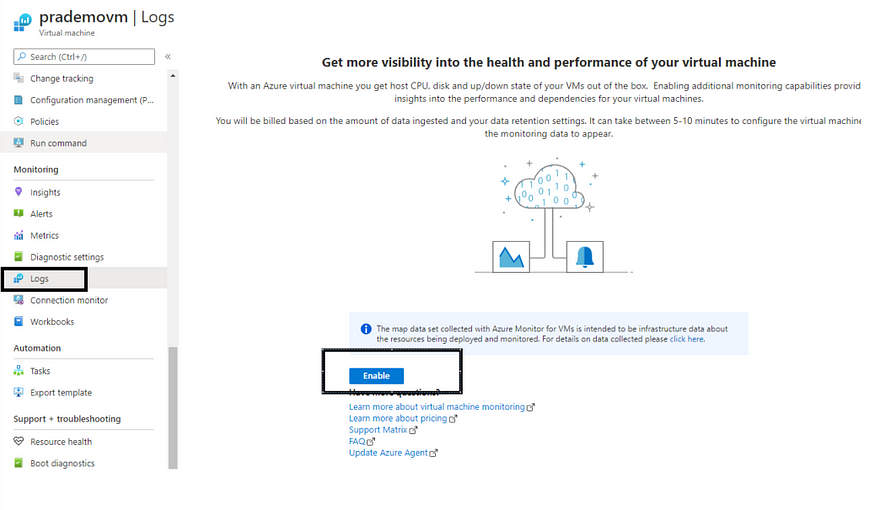
5. Now once again go back to Azure VM → Logs → Click on Enable
6. It will ask for new LogAnalytics Workspace details.
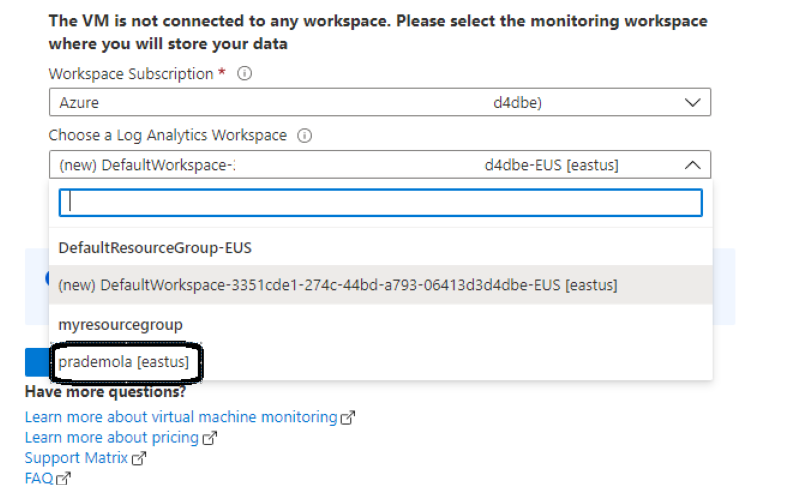
9. Select the one which you have created earlier → click on Enable.
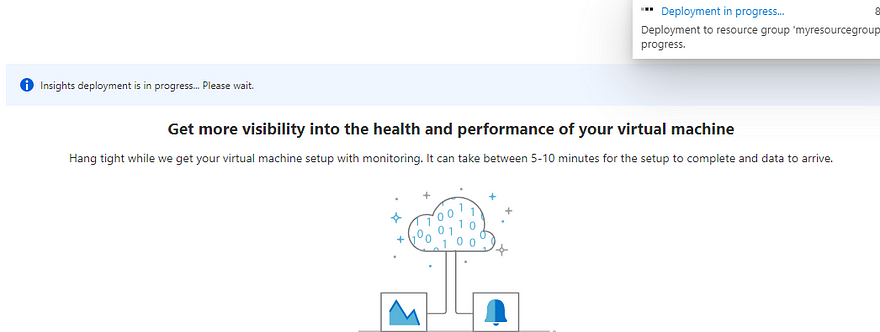
It may take up to 5–10mins to get it enabled.
10. Now once again open Log Analytics Workspace → go to Logs → now you should be seeing few new options such as
- Azure Monitor for VM’s
- Custom Logs.
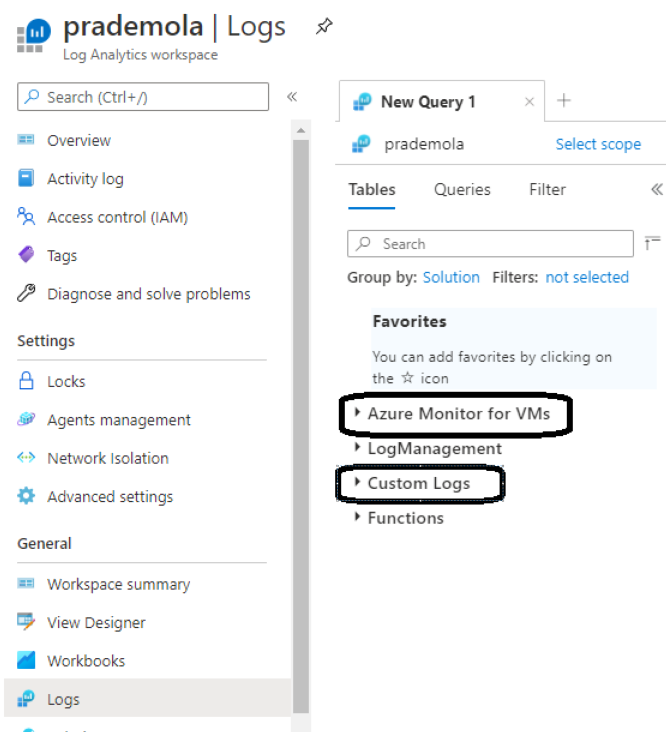
Once you expand you see different operations that you can perform to get data out of Azure VM windows services.
Final Validation.
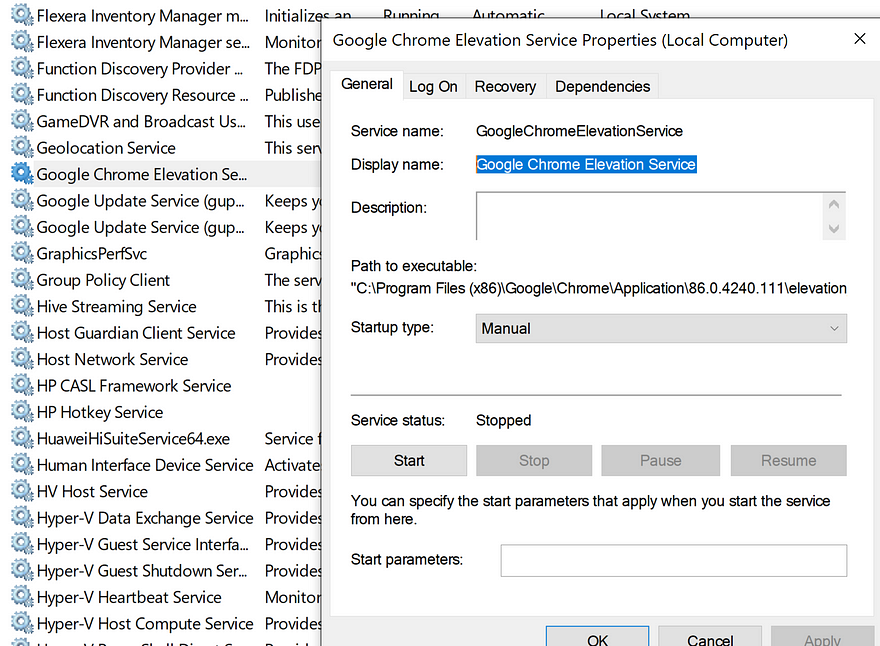
- Let's login to Azure VM → As a part of the demo let me try to install few software's → so that it can create some windows services. In my case, I have just installed “Google Chrome Browser”. (it has added few dependent services).
- Open Services.msc → Now you can see few Google chrome services got created → let's start/stop those services in Azure VM. → Copy the Display name of the service.
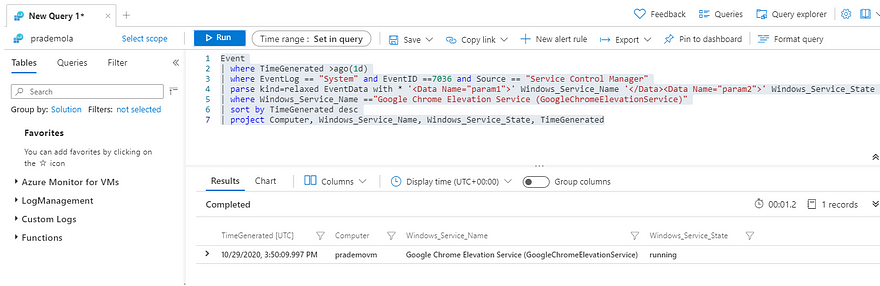
3. Go to LogAnalytics → General → Logs → Paste below query
Event
| where TimeGenerated >ago(1d)
| where EventLog == “System” and EventID ==7036 and Source == “Service Control Manager”
| parse kind=relaxed EventData with * ‘<Data Name=”param1">’ Windows_Service_Name ‘</Data><Data Name=”param2">’ Windows_Service_State ‘</Data>’*
| where Windows_Service_Name ==”Google Chrome Elevation Service (GoogleChromeElevationService)”
| sort by TimeGenerated desc
| project Computer, Windows_Service_Name, Windows_Service_State, TimeGenerated
4. Now you can see the result.
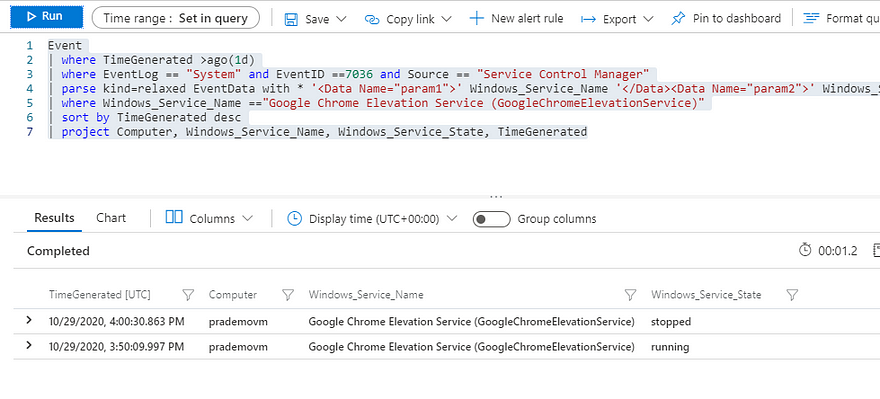
5. Now let's go ahead and stop the service in Azure VM → you can see the result below
6. Final step is to getting email alerting → on Log Analytics → Query editor window → click on + New Alert rule

7. After I stopped the service on Azure VM after 5mins or so I got an automated alert email onto my mailbox. Below is a snippet of it.
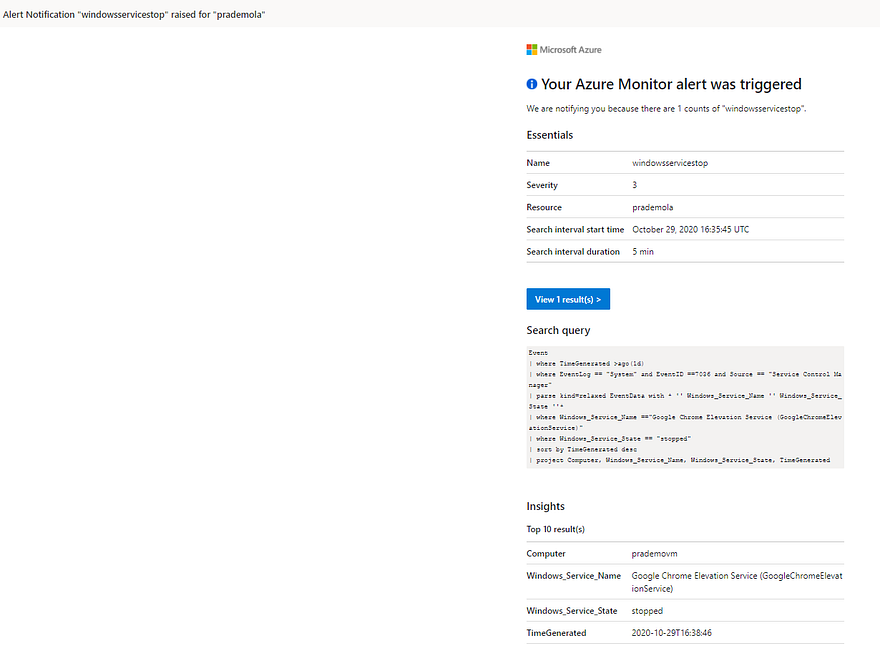
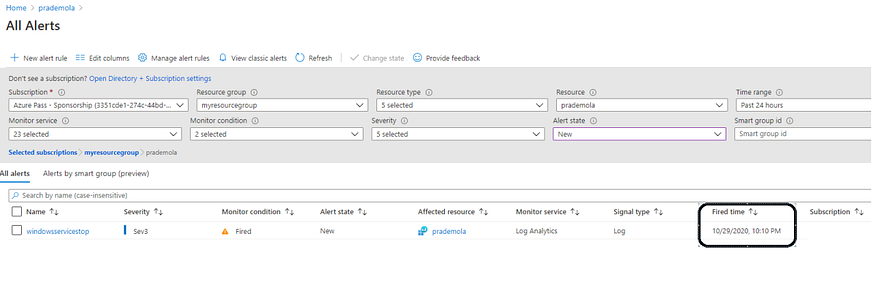
Also if I go back to Log Analytics Workspace → alerts, you can see triggered alerts as well with a timestamp.
Another important check to see VM is connected with Specified LogAnalytics blade or not →Open Log Analytics workspace →Go to Workspace Data sources → click on Virtual Machines. You can see all connected virtual machines (with green/ or else it will show greyed out) who are using this Log Analytics Workspace with its status.

Happy Learning.